Dashboard Overview
The Dashboard is your at-a-glance view. It pulls together the same numbers as the P&L page plus a few visual breakdowns, so you can check the week's pulse without digging into individual pages.
Sections
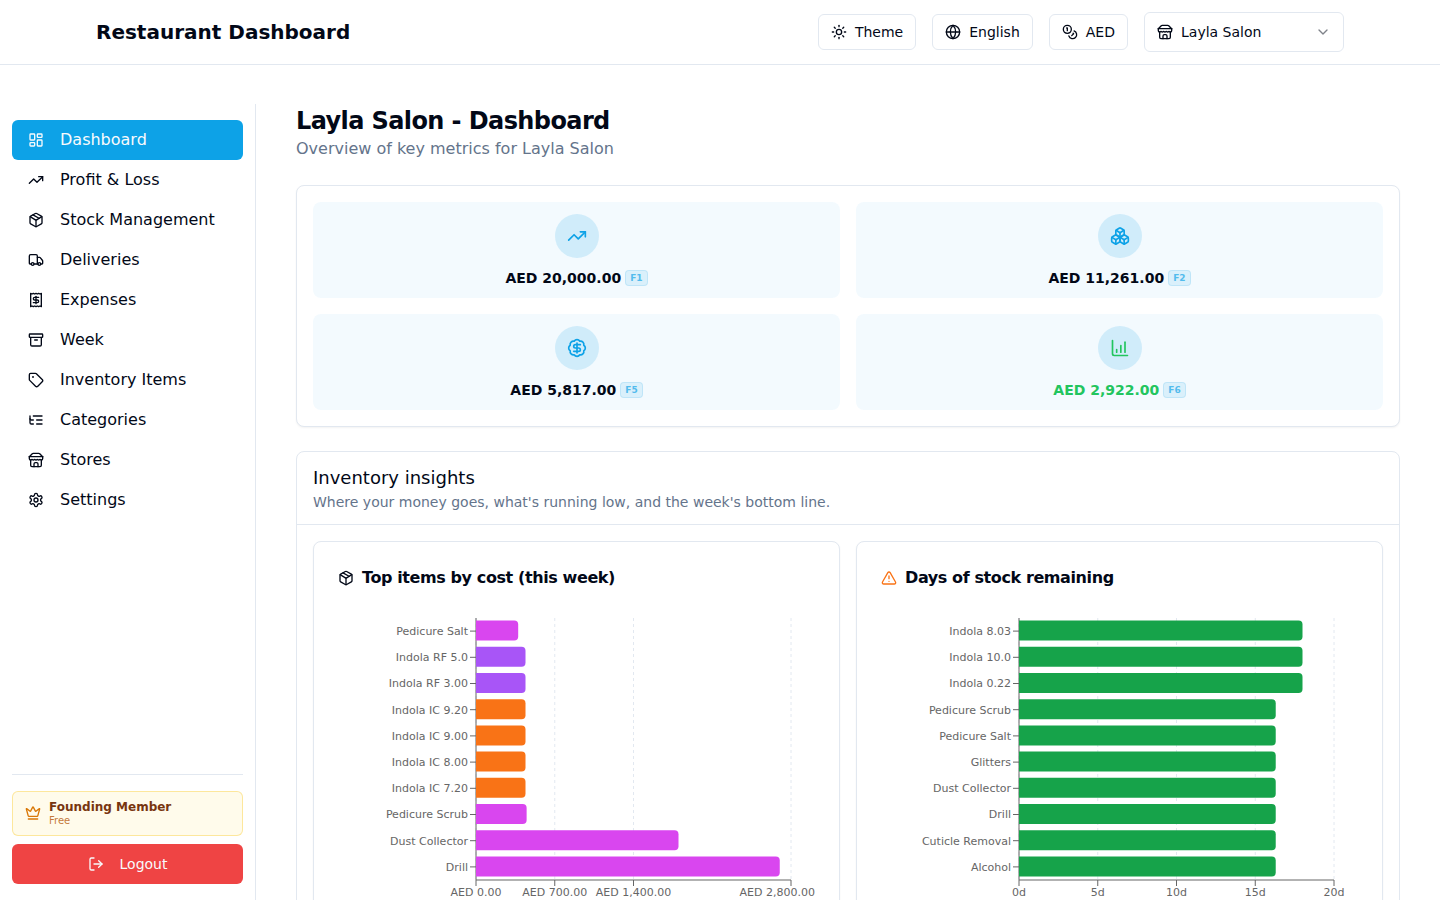
Top KPIs (4 cards)
- Revenue — what you entered on the P&L page.
- COGS — total cost of goods consumed (from Stock Management).
- Expenses — total operating expenses (from Expenses page).
- Net Profit — Revenue − COGS − Expenses (green if positive, red if negative).
Inventory insights — three charts:
- Top items by COGS this week — which items ate most of your money. Useful for knowing where to negotiate with suppliers or check waste.
- Days of stock remaining — based on this week's usage rate, how long current ending counts will last.
- P&L waterfall — visual breakdown from revenue → COGS → expenses → net profit.
The charts only render once you've entered some Beginning/Ending counts. If you see "No usage recorded yet" placeholders, head to Stock Management and enter counts first.
Why glance at this page
- Daily: catch a margin crash early (e.g. if costs spiked Tuesday).
- Weekly: confirm you closed the week in profit before rolling over.
- Monthly: compare four consecutive Net Profit numbers (in the Week page archive list) to spot trends.