Stock Management — Beginning & Ending Counts
This is the page you open at the start and end of each week. You enter how much of each item you have, the app computes everything else (usage, cost of goods sold, total value).
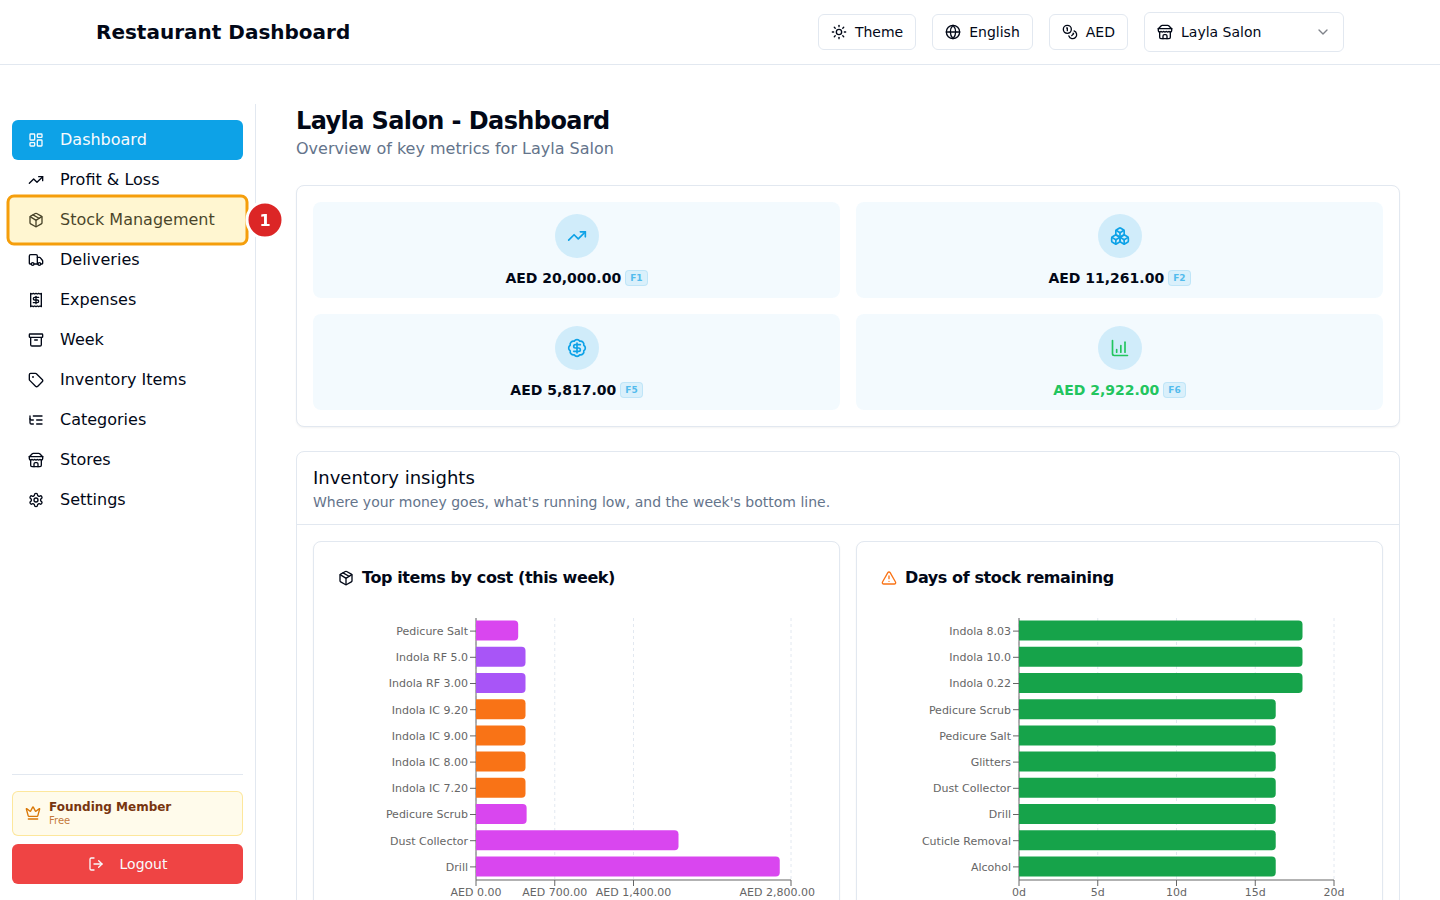
1. Open Stock Management
Click Stock Management in the sidebar.
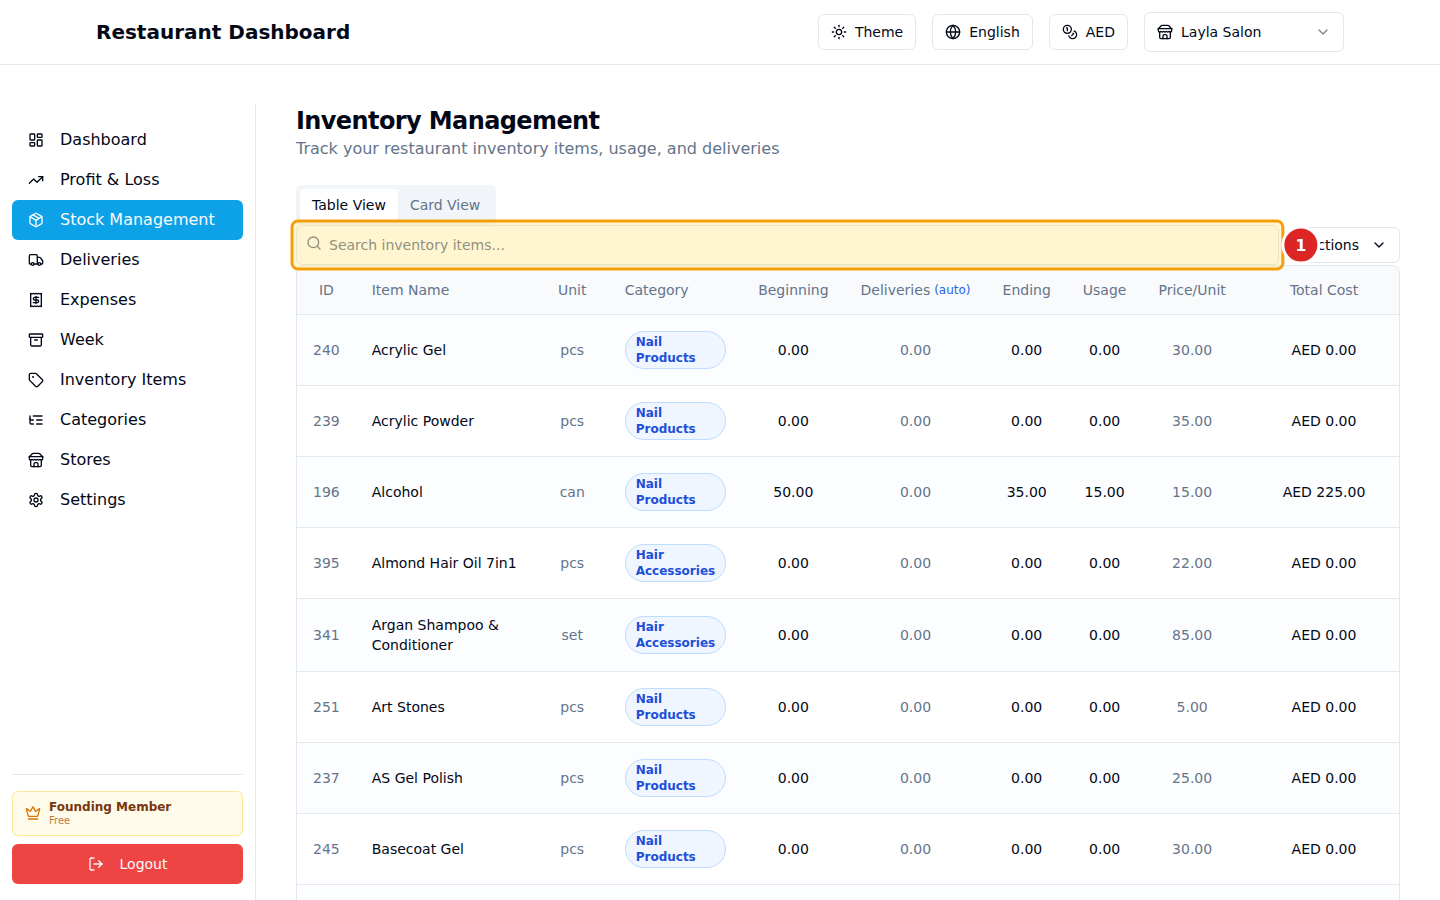
2. Find an item
If you have many items, type into the search bar. It matches name, category, or unit.
3. Enter counts
Each row is one item. Click into a cell to edit:
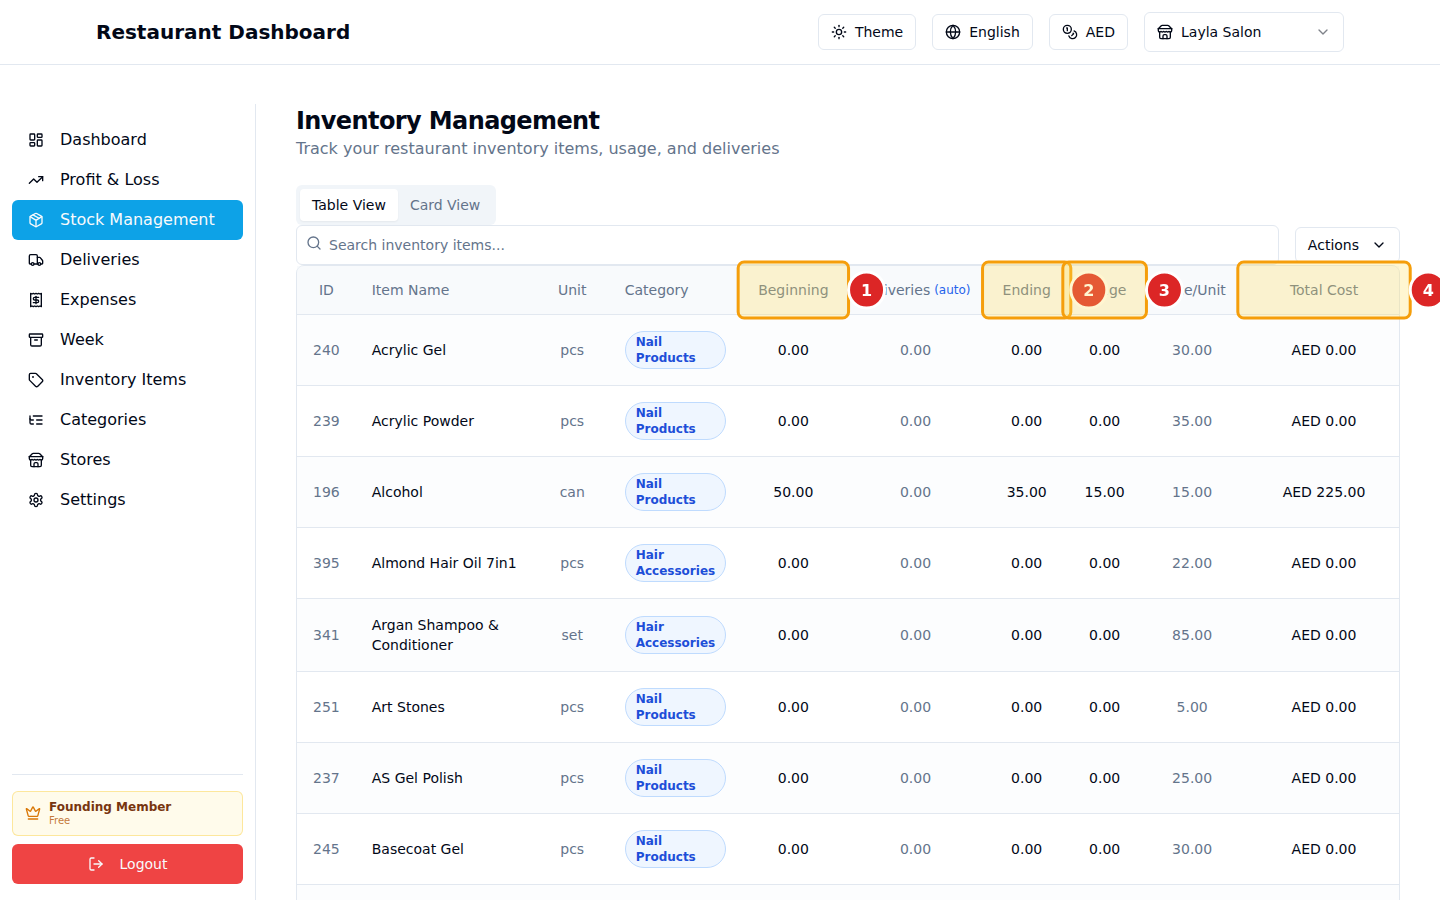
- Beginning — how much you had at the start of the week.
- Ending — how much you have right now (or at week-end).
- Usage — auto-calculated:
Beginning + Deliveries − Ending. - Total Cost — auto-calculated:
Usage × Price per Unit. This is what feeds the COGS line on your P&L.
The Deliveries column is also auto-calculated — it's the sum of every delivery you logged for that item this week. You don't enter it here; you enter it on the Deliveries page.
How the math works
For Olive Oil with Beginning=10, Deliveries=5, Ending=8, Price=AED 20:
- Usage = 10 + 5 − 8 = 7 units
- Total Cost (COGS) = 7 × 20 = AED 140
That AED 140 is what you "consumed" this week. It rolls up into your Profit & Loss statement automatically.
At the end of the week
Once you've entered ending counts for every item:
- Glance at the P&L page to see the impact.
- Go to Week → End this week to archive the week and roll endings into next week's beginnings (see the Week Management guide).
Common questions
My total cost looks wrong. Check the Price per Unit column on the same row. If you've been buying at a different price than what's set on the item, edit the item's default price (Inventory Items page) — or override on a specific delivery (Deliveries page).
I forgot a count for one item. Just leave it as 0 — it'll show 0 usage and 0 COGS. You can come back and edit any cell at any time during the week.